How to build the shop out of separate embed codes?
Just pop your question below to get an answer.
How to build the shop out of separate embed codes?
Current Process for Report Sales When Integrating a Chart on Your Website
1.A customer visits the website.
2.The customer opens the chart submission form and fills it out.
3.The chart is generated, and corresponding reports are created and displayed as widgets on the chart result page.
Many of you have asked how to embed a standalone report and bypass the form submission and chart generation steps to directly promote specific reports. Unfortunately, the form submission step cannot be skipped. As you’re aware, our report calculator uses a customer’s date of birth and location to provide tailored insights (leveraging page visibility features and shortcodes). Skipping the form would result in a generic file containing all HD properties, without any customization for the customer. Therefore, this step is essential to ensure automated report generation.
Fortunately, there is a workaround, and this article outlines the general principle of this method. Please note, the exact setup will vary depending on the website builder you use. The goal of this article is to explain the concept, while the precise implementation will depend on the platform your website is built on.
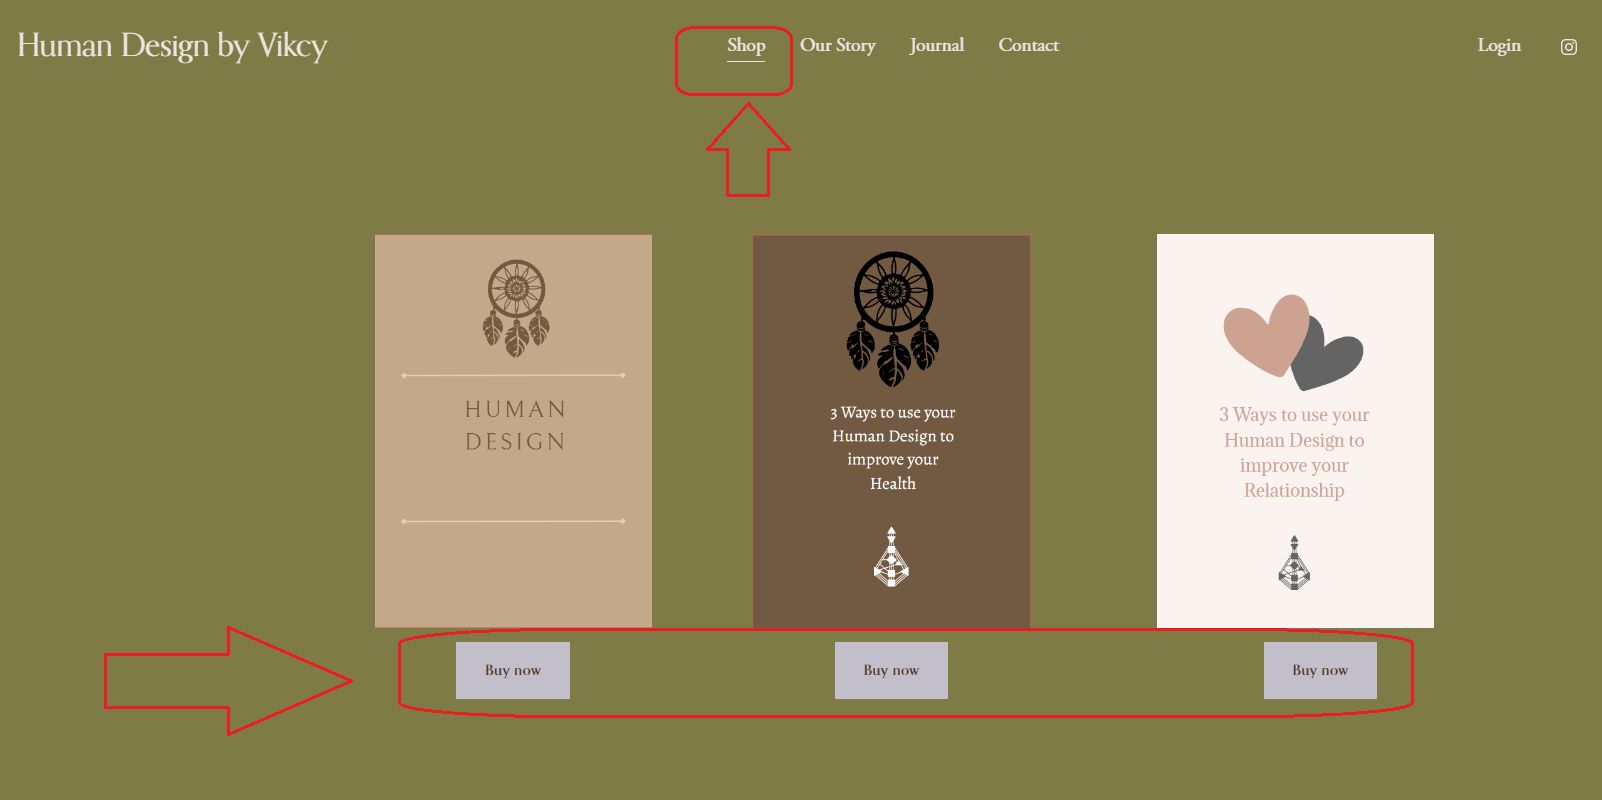
Here are the steps you’ll need to follow (this example is based on the sale of three paid reports, but the same method applies whether you’re selling one report or twenty):
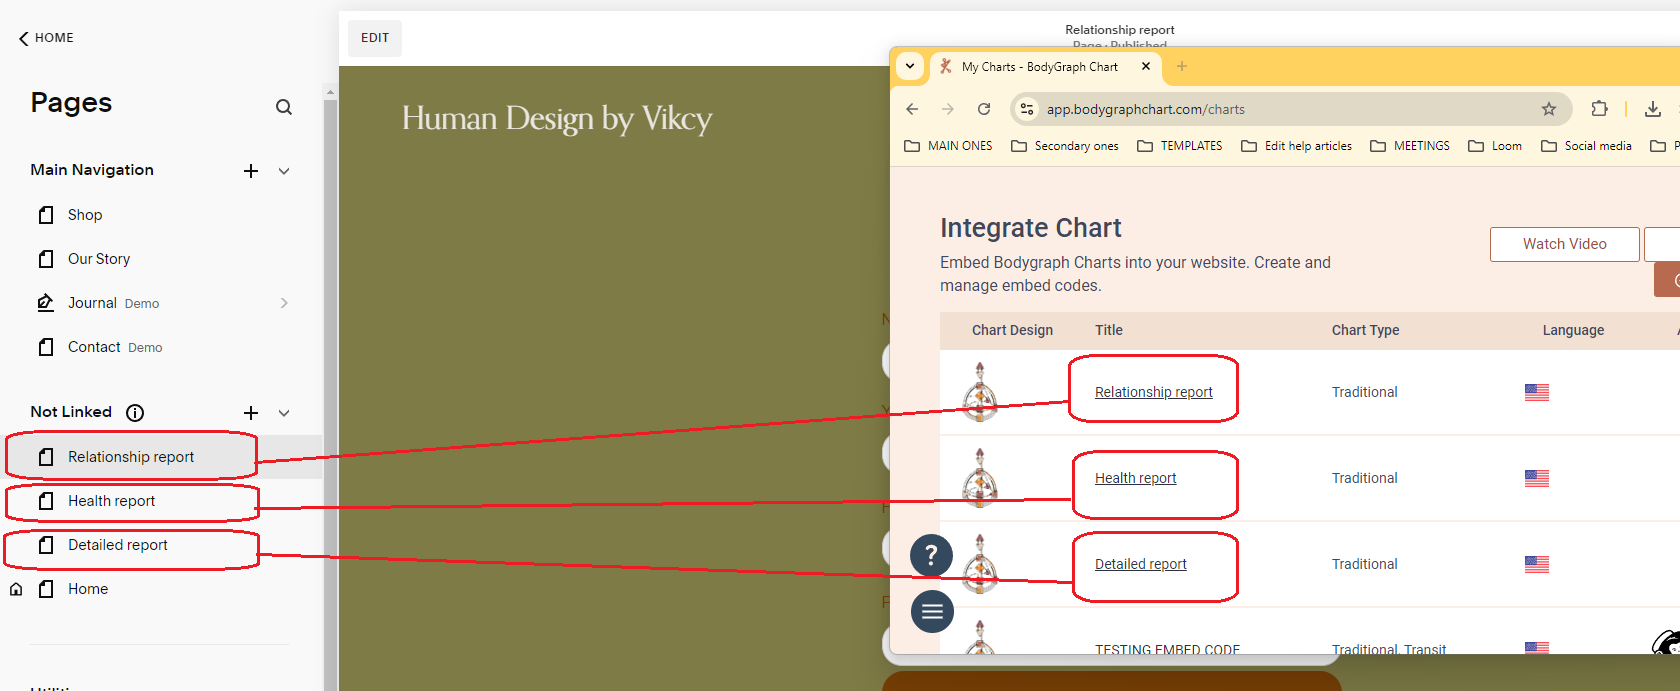
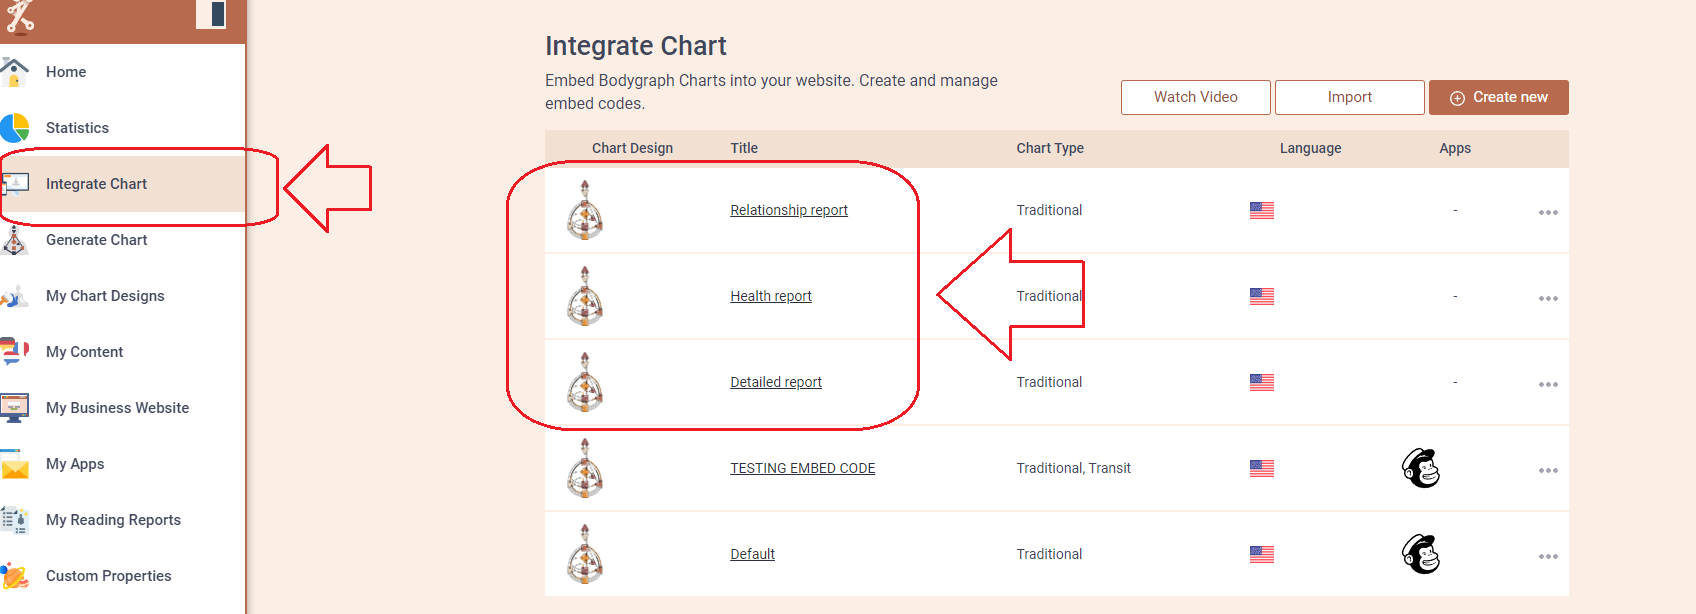
1. You will need to create a separate embed code within the “Integrate Chart” section and name it according to the specific report. This will allow you to easily identify which report the embed code is associated with:
2. Copy and paste the following CSS codes to each of these embed code CSS fields (these will hide chart and properties from the result page leaving just a report widget):
.bgec-chart-details {display:none}

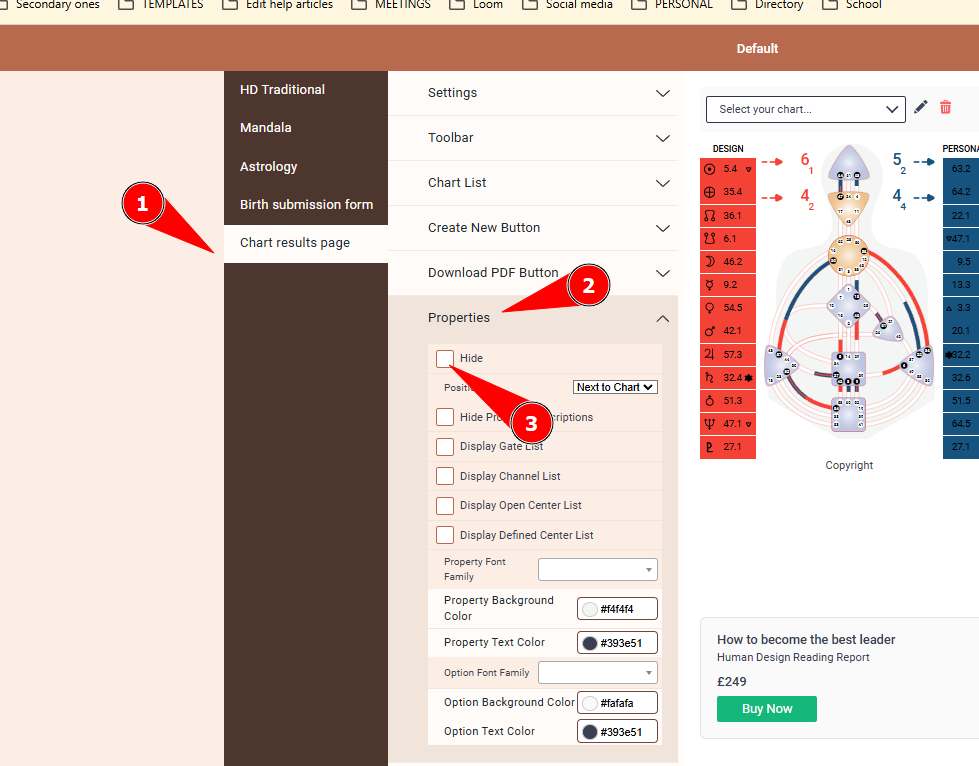
3. Hide properties at the design tool:
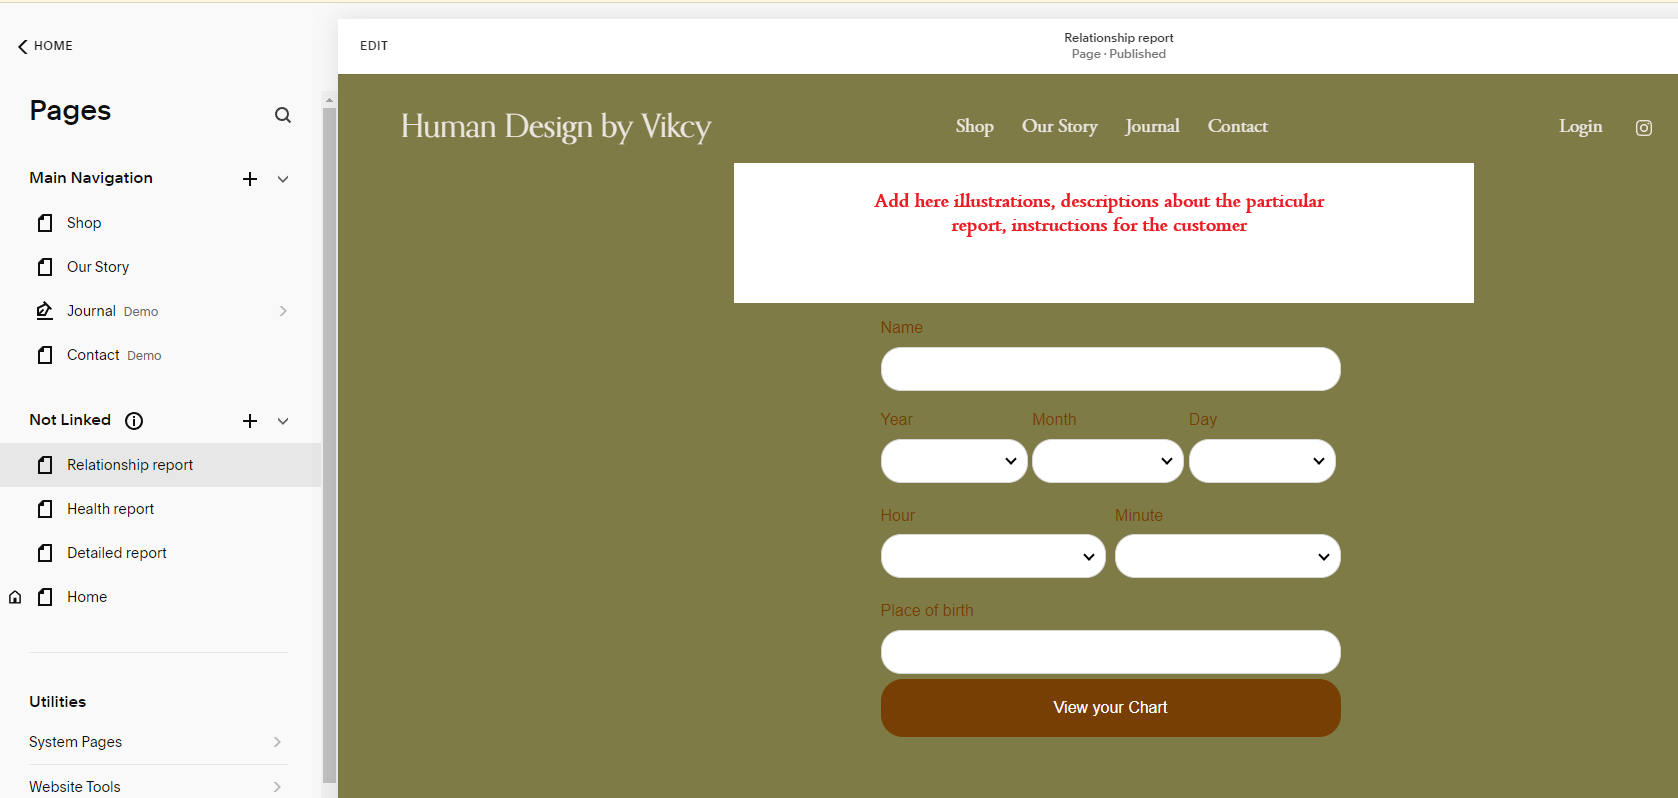
4. Create the shop page (accessible from menu) at your website and add report illustrations, descriptions and most importantly call to action buttons for each report:
4. Create 3 hidden pages dedicated to each report and link them to call to action buttons:
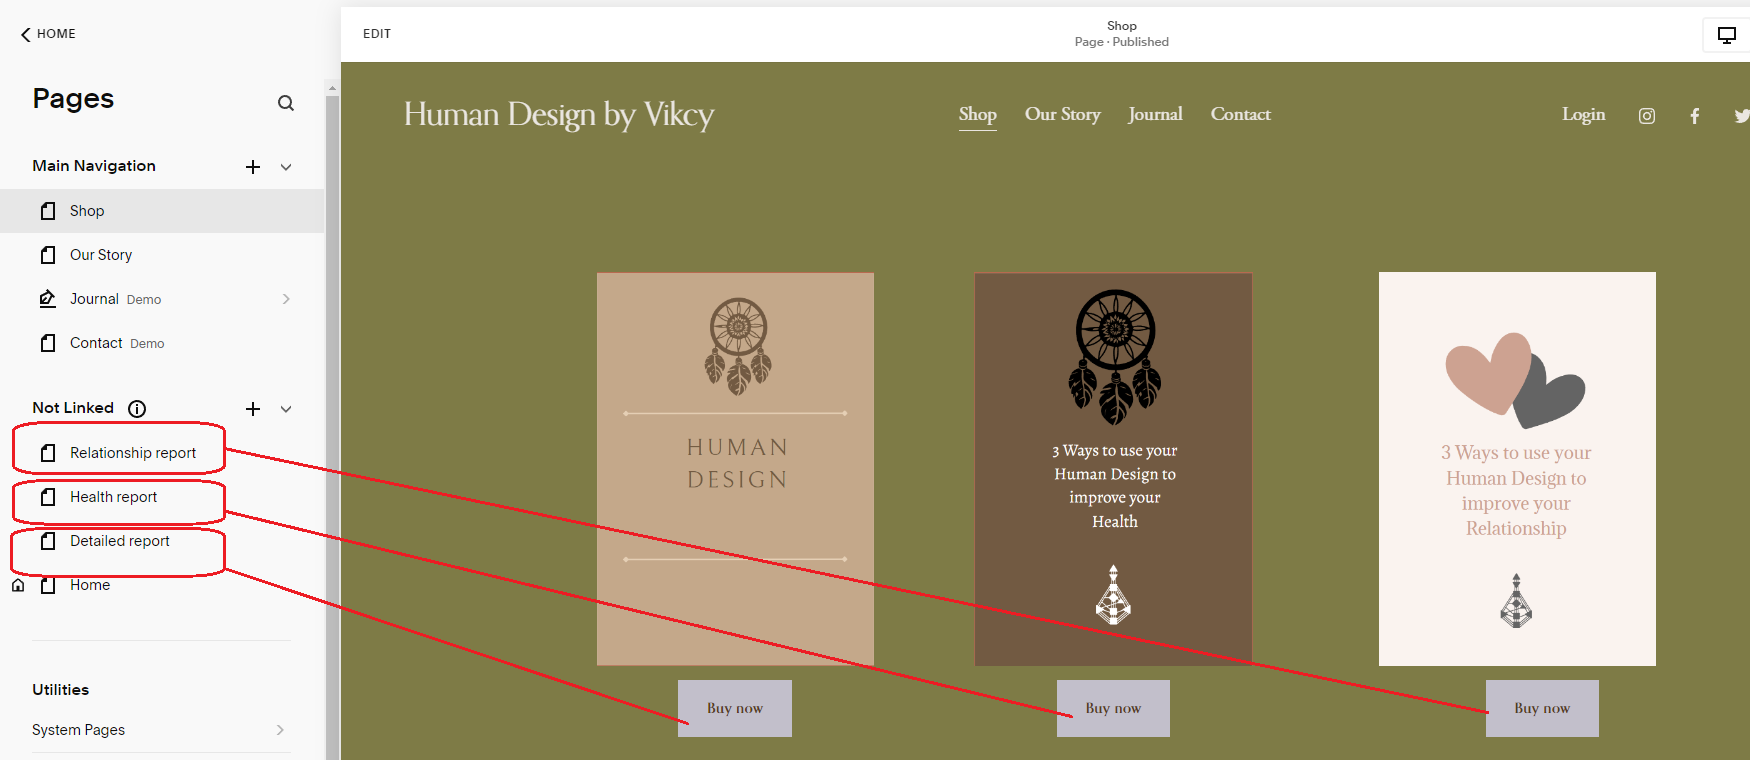
5.Embed each dedicated embed code to dedicated report page: