Mandala
Just pop your question below to get an answer.
Mandala
To add the Mandala Chart to the report, proceed as follows:
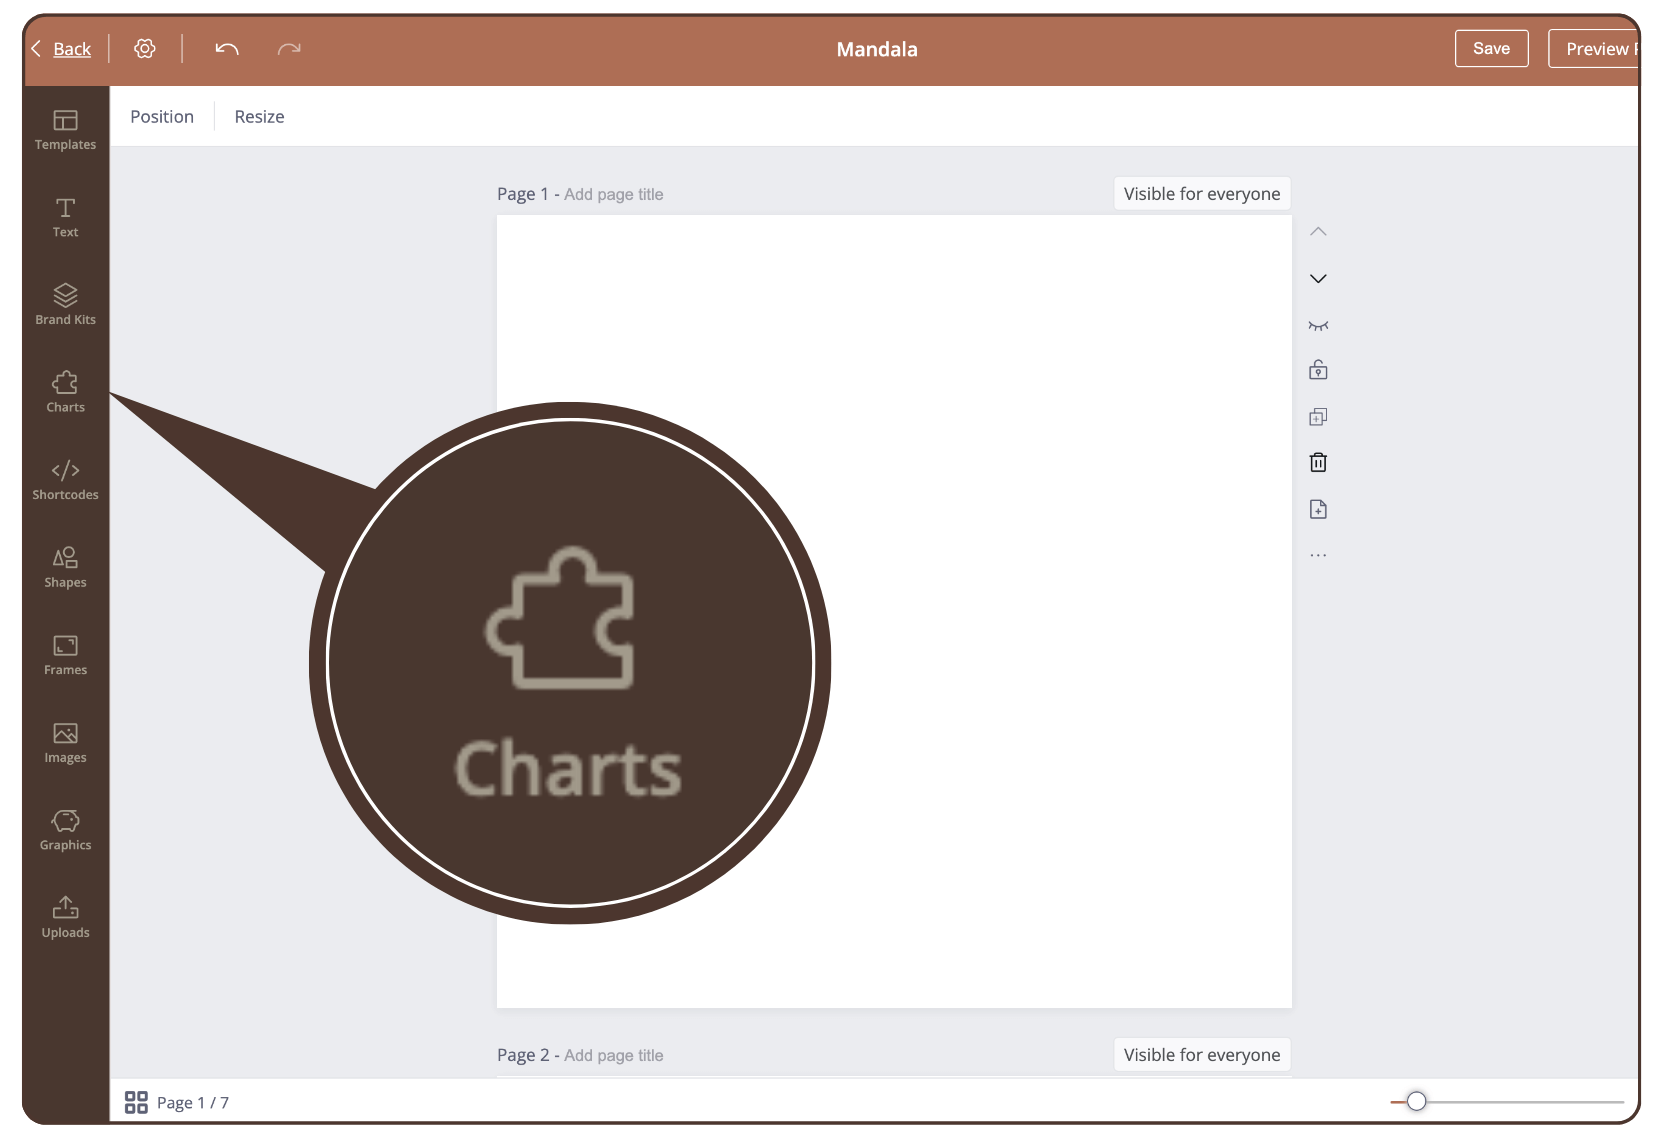
Step 1
Click on ‘Charts’ in the left sidebar.
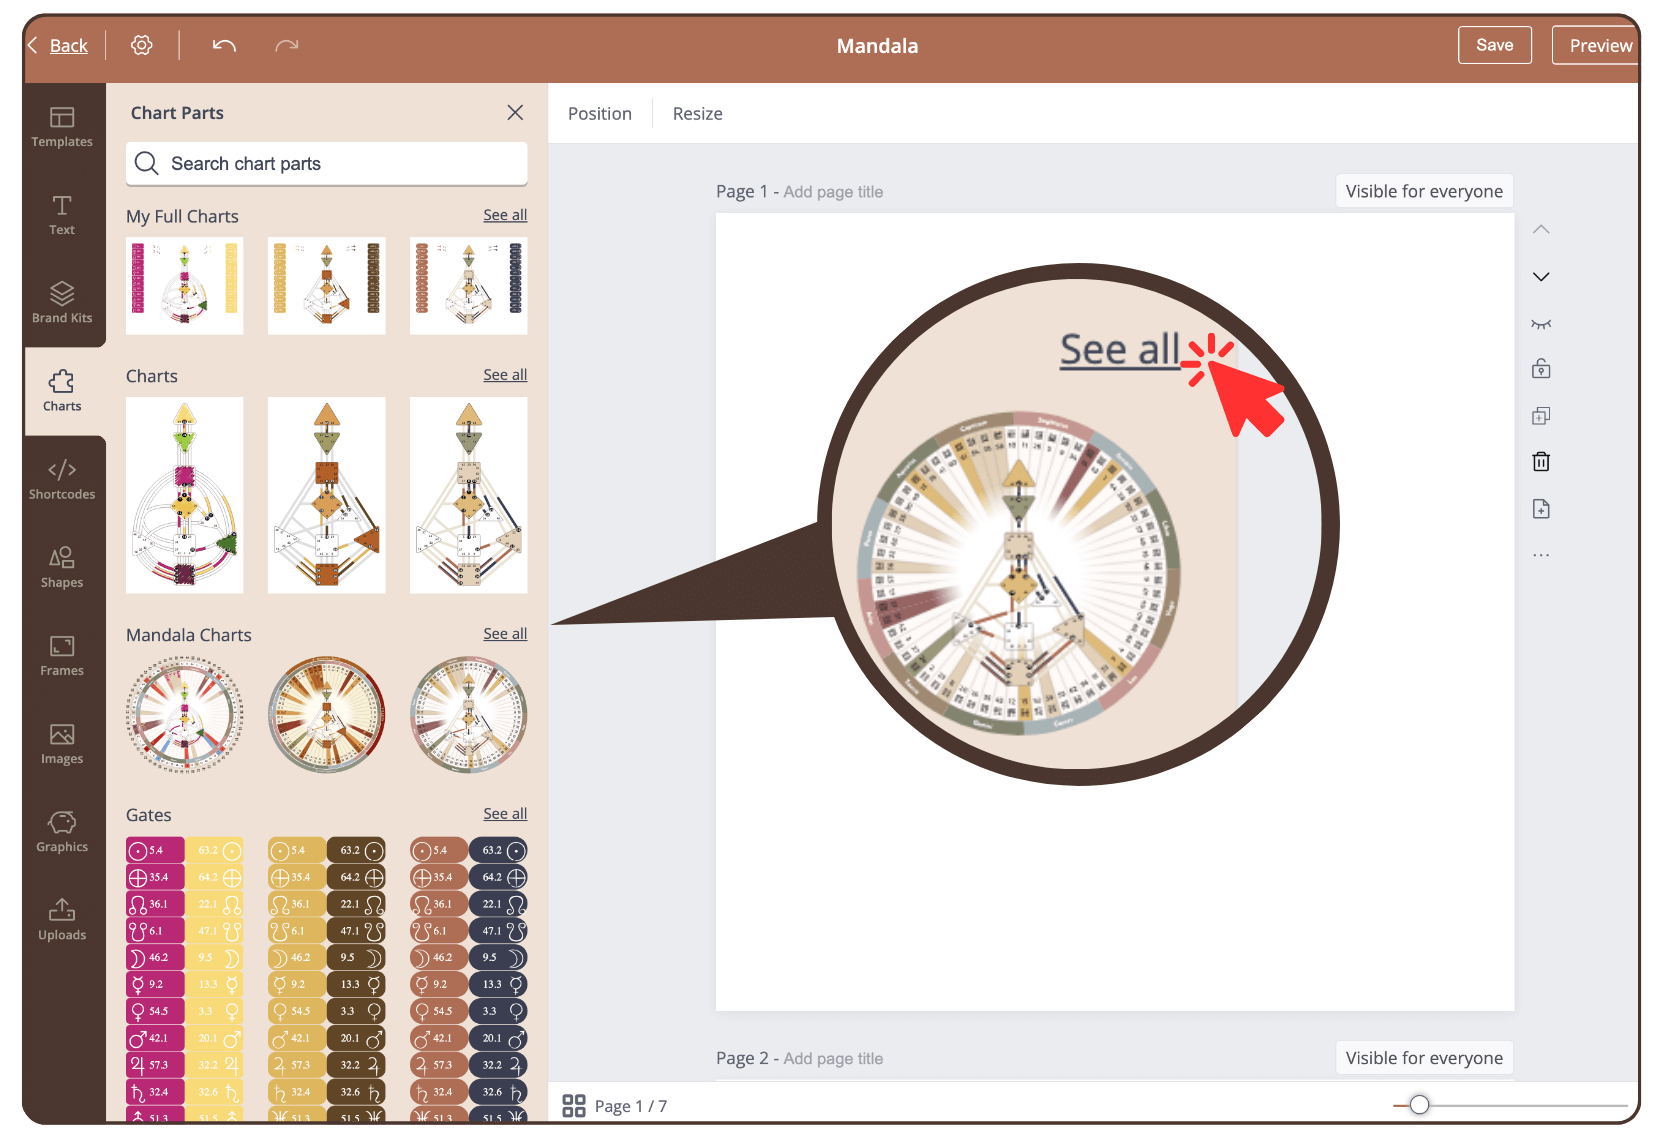
Step 2
Click on ‘See all’.
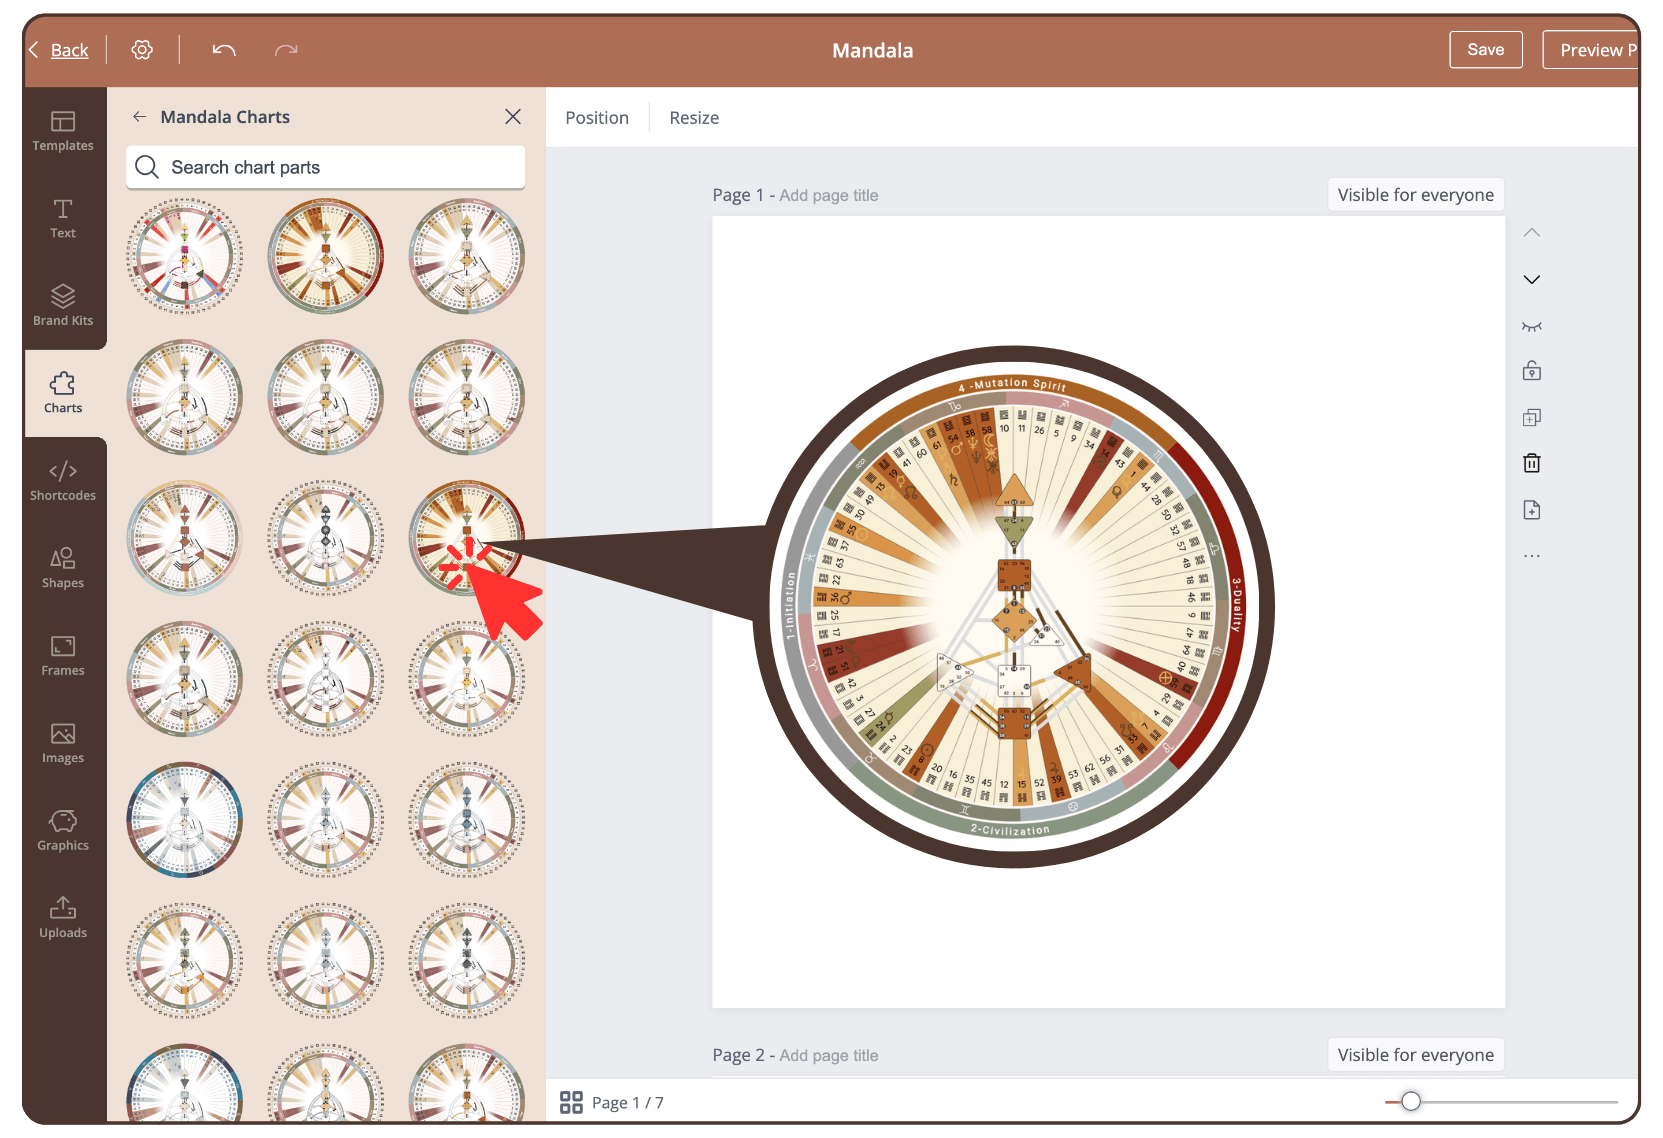
Step 3
Click on a mandala design of your choice to add it to the current page.
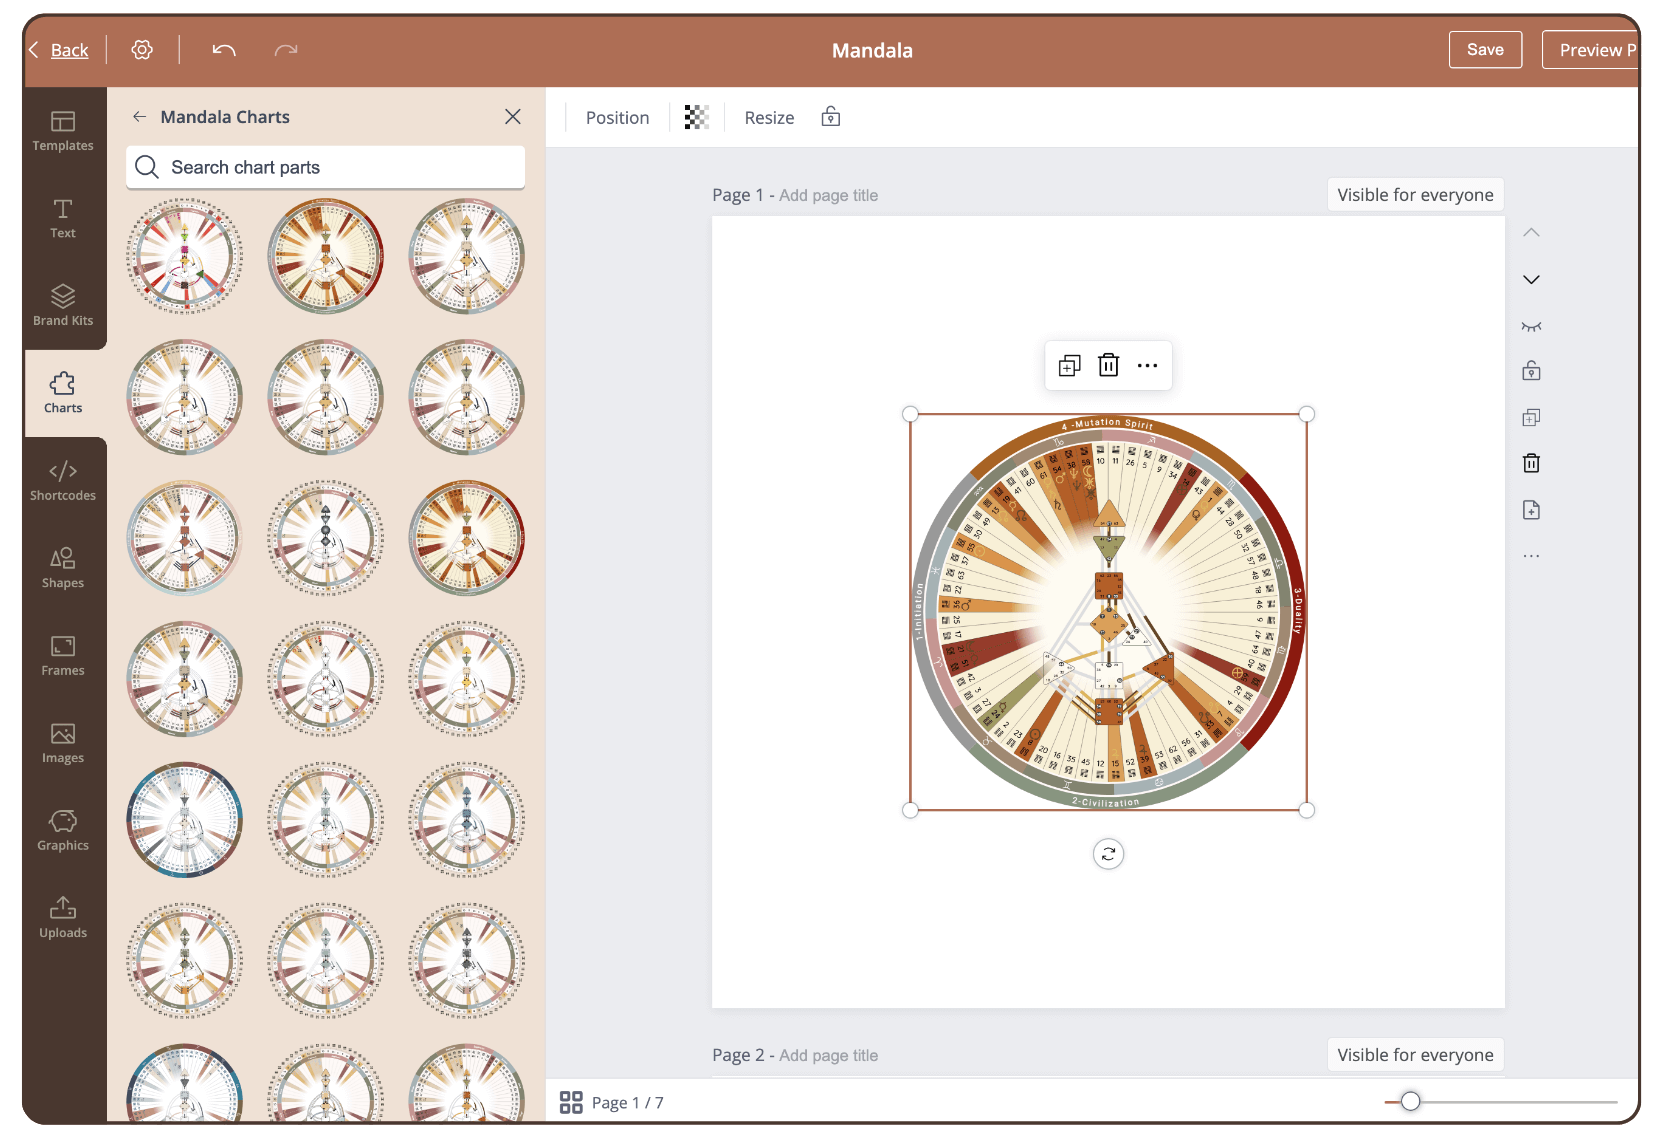
Result
The mandala chart has been added to the page and can now be scaled and arranged.
Similar question:
How to use the Mandala Chart in the report?
Still have questions? Please message us on Live Chat or send an email to [email protected].
