What is Chart Presentation tool?
Just pop your question below to get an answer.
What is Chart Presentation tool?
Chart presentation tool is a great tool where you can mark chart elements as defined/undefined manually just by pressing on them.
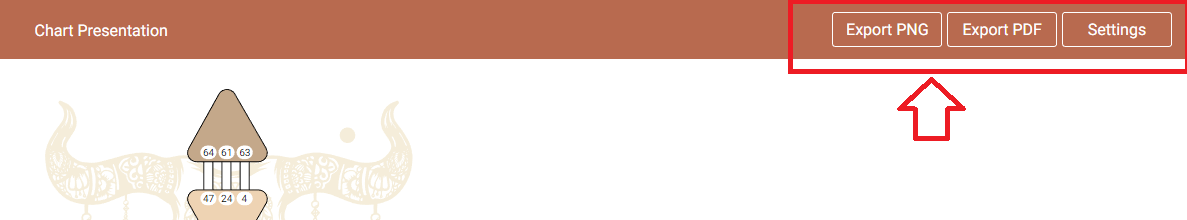
You can also export PNG image or PDF file for your business use, such illustrations of your reports, social media posts, books, etc..
Overall, chart presentation tool is perfect for generating illustrations, making video recordings, and, most importantly, running group meetings. For instance, you can print out or send and request printouts of customers’ charts and then explain, using the presentation tool, what it means when certain parts are defined or undefined. This way customers can compare this information with their own charts. It certainly enhances their chart understanding and engagement.
